When 'scan completed successfully' means nothing
- Edgar Bellot Micó
- Data driven scans
- April 12, 2026
Table of Contents
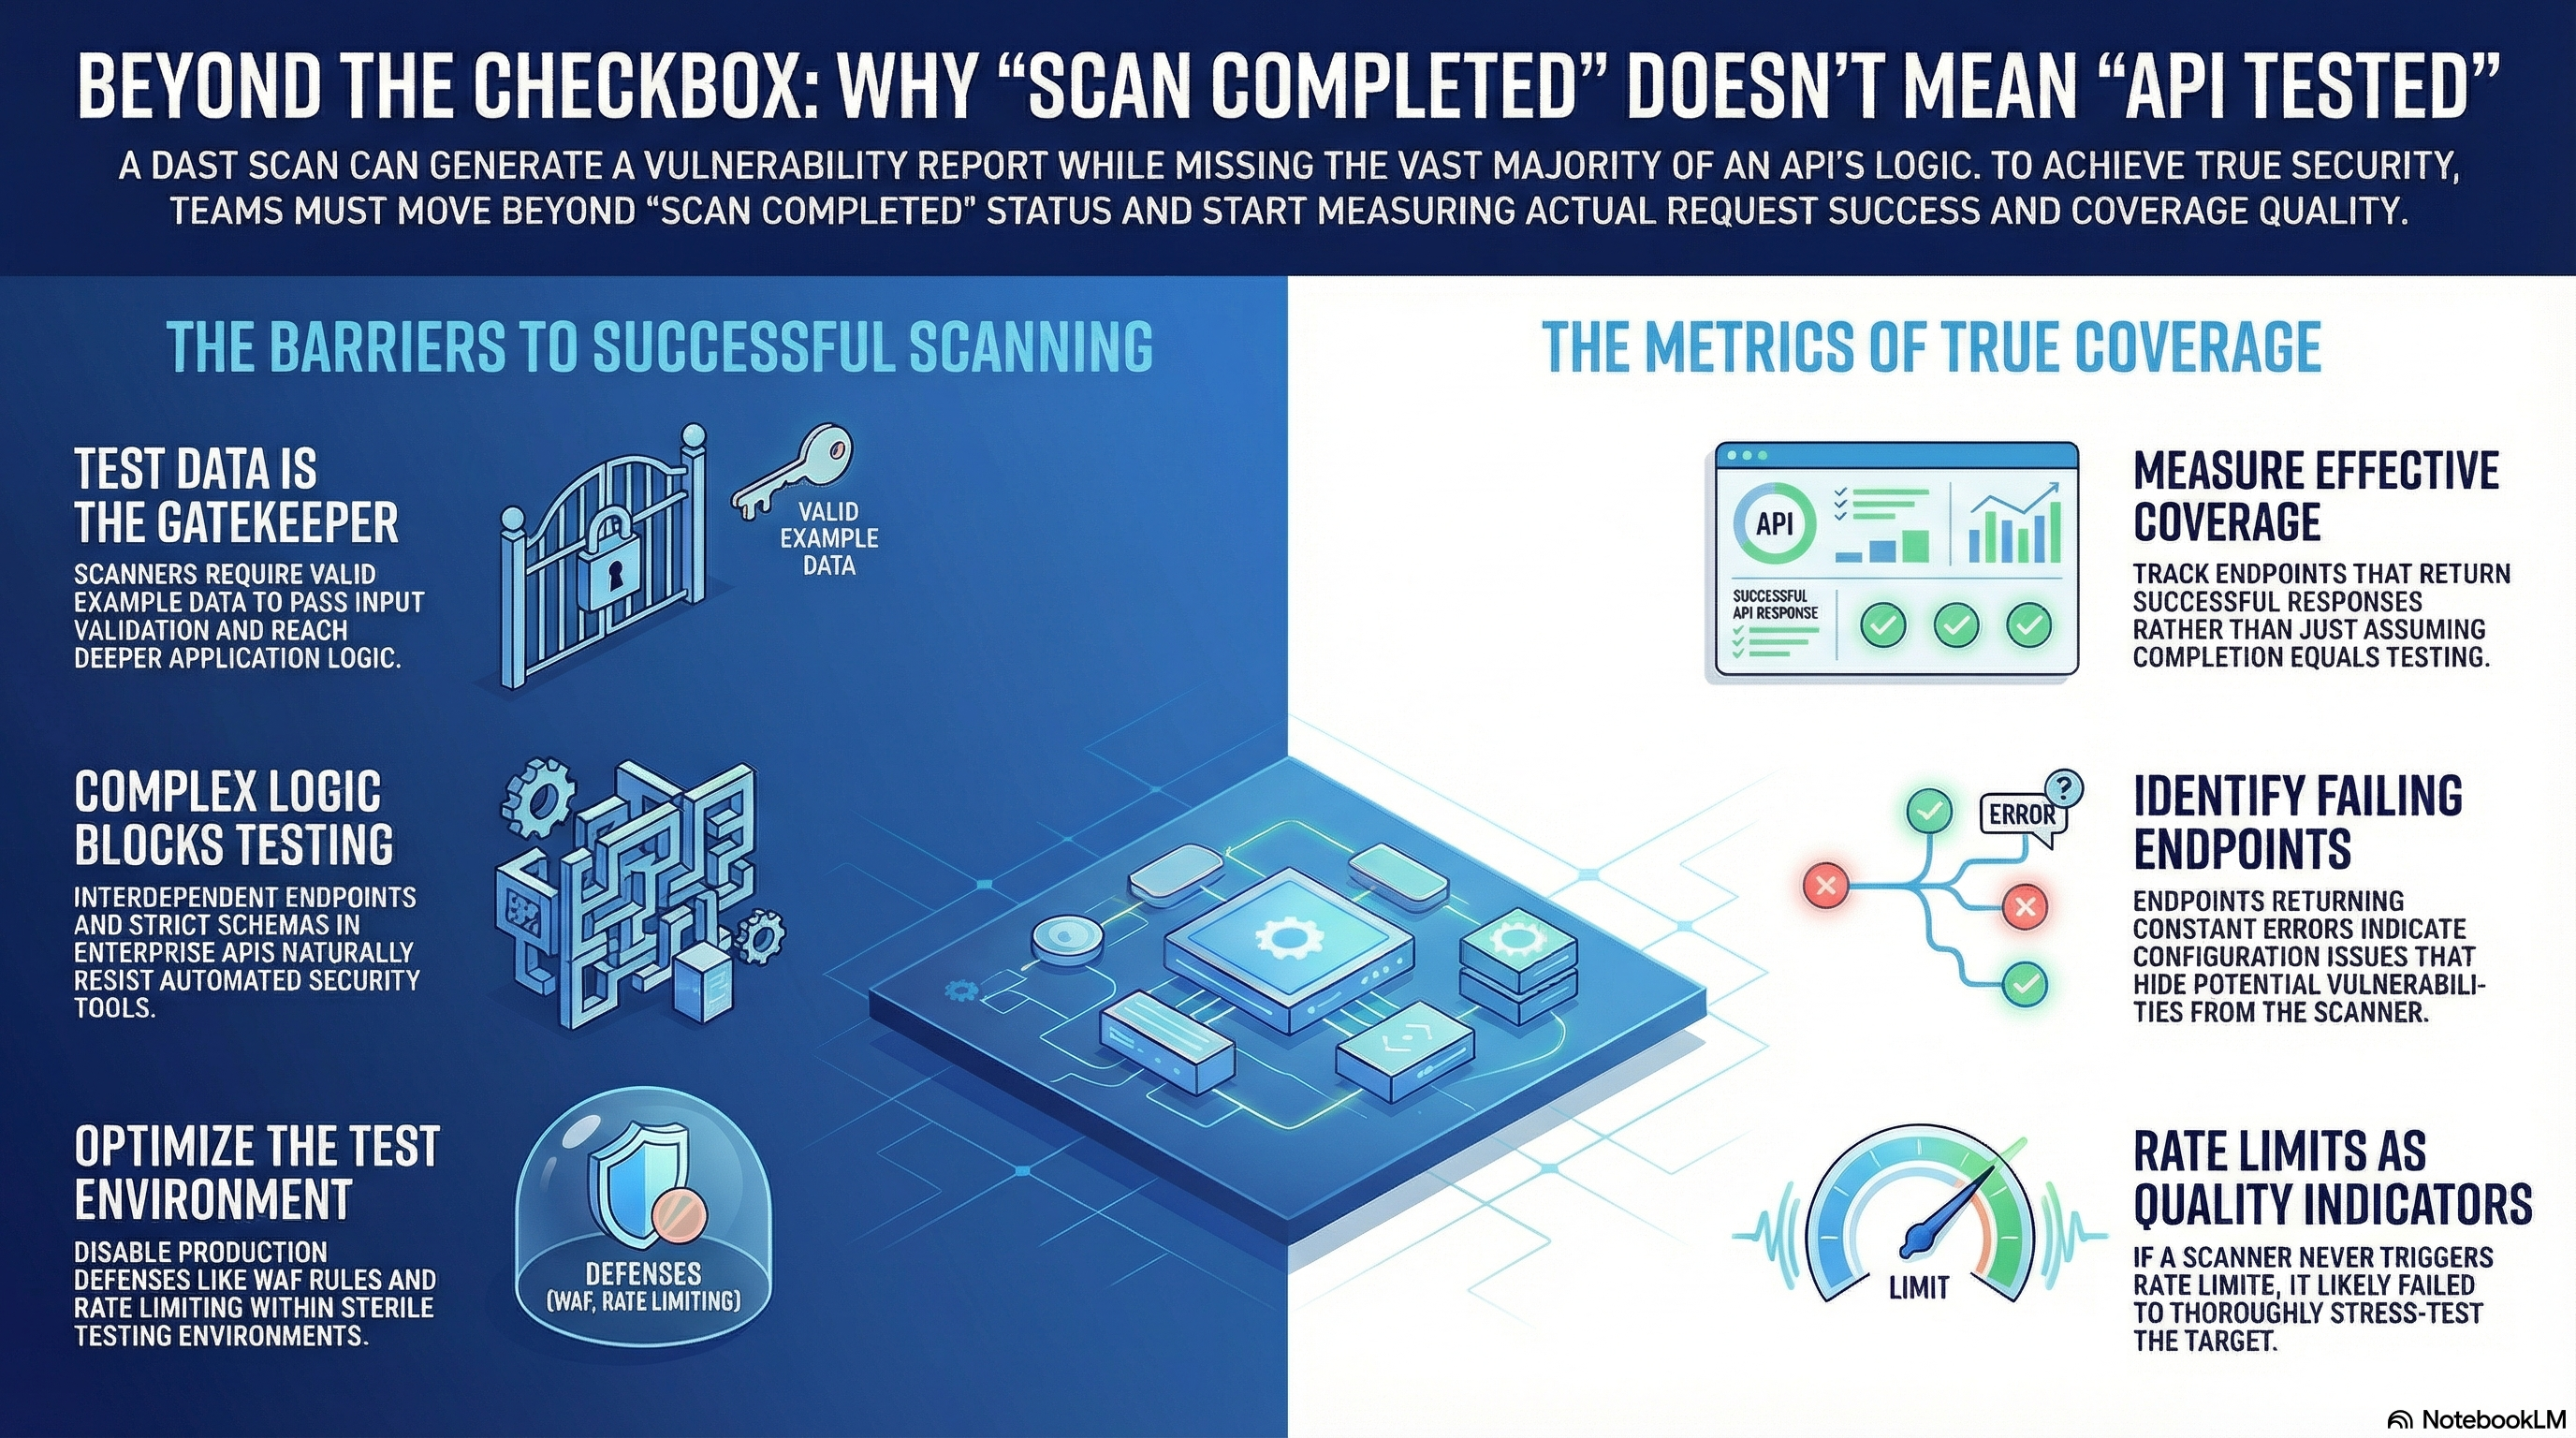
A security scan just finished. The report shows some vulnerabilities. The security checkbox gets marked. The deployment proceeds. But here’s what nobody asked: how much of the target was actually tested?
“Scan completed” and “target tested” are not the same thing - and the gap between them is larger than most teams expect. It doesn’t matter whether the scan was automated, AI-assisted, or manual.
This post is the first in a series where metrics, not reports, guide the path to scan quality. The data below will show what that gap looks like in practice.
The setup: two APIs, one scanner
To show what good measurement looks like versus guessing, two APIs will be scanned throughout this series:
- crAPI: OWASP’s intentionally vulnerable API. It’s designed to be exploited, which makes it perfect for tracking how security findings evolve as scan quality improves.
- EnterpriseAPI: A FastAPI application with Pydantic validation and complex business logic. This one reflects what you’d typically find in a real enterprise environment: strict input validation, interconnected endpoints, and workflows that require specific data to function.
Both APIs will be scanned using the same OpenAPI specification file in every test. This ensures that all experiments are comparable.
The scanner used throughout this series is ZAP, running in DAST mode. DAST was chosen deliberately: unlike manual or AI-assisted approaches, automated scans are more comparable across runs - same configuration, same payloads, same target, same results. That consistency is what makes it possible to measure the impact of each improvement across iterations.
These targets are both APIs, but the principles demonstrated throughout this series apply equally to web applications, mobile apps, or any other system that processes requests. The measurement framework, the failure modes, and the quality signals are the same regardless of asset type or testing method.
The baseline configuration
For this first experiment, the configuration applied was intentionally minimal:
- ZAP’s default API scan policy with its out-of-the-box settings
- A Replacer rule to inject the authentication token into the Authorization header
- Slightly optimized Active Scan settings for API testing
What the metrics tell us
Once any dynamic security scan completes, looking at the final report isn’t enough. Understanding what actually happened requires digging into the data. These metrics apply universally:
- Endpoints/URLs - Total endpoints/URLs in scope
- Scanned - Endpoints/URLs that returned at least one successful response (labeled “Reached app logic” in the charts). This is a critical distinction: a request counts only if it passed validation and actually executed code inside the application, not just if a request was sent and rejected.
- Failing - Endpoints that always return HTTP 4XX/5XX errors
- Unscanned - Endpoints in scope that were never tested
- Hitting rate limits - Endpoints returning rate limit responses
Why does “Failing” matter? If an endpoint returns errors on every single request, it often means the scanner never reached the intended business logic. That’s not a scanned endpoint, it’s a configuration problem hiding in plain sight.
Coverage results


The “Effective coverage” metric tells the real story. It’s the percentage of endpoints where valid requests actually reached the application logic. In crAPI, more than half the attack surface was tested. In EnterpriseAPI, only one endpoint in six was.
The endpoints that never reached app logic appear as failing in the raw results. From the scanner’s perspective, they’re invisible.
Vulnerability findings


The contrast is stark. crAPI, designed to be vulnerable, shows 31 findings across 10 different vulnerability types. EnterpriseAPI shows just 2 findings, both informational or low severity.
Is EnterpriseAPI more secure than crAPI? Maybe. But in this case, the scanner simply couldn’t test it properly.
Rate limits: the silent killer of automated scans
Rate limiting is usually treated as a footnote in scan reports. It shouldn’t be. It’s one of the most common reasons a scan looks complete while covering almost nothing.
When a scanner encounters a 429 response, it may slow down - reducing its global request rate or thread count. The result is more subtle and harder to detect: fewer payloads reach each endpoint before the scan completes, silently degrading coverage depth across the board. There is no indication in the final report that testing was incomplete.
This is a stealthy failure. The scan finishes. The report generates. Every endpoint appears in the output. Nothing flags as “skipped due to rate limiting.” The coverage gap is invisible unless you go looking for it in the raw traffic logs.
EnterpriseAPI has a rate limit of 40 requests per minute on all endpoints. For this baseline test, rate limiting was intentionally left enabled to measure how many endpoints would be affected.
A well-configured scan is expected to generate enough valid traffic to meaningfully exercise each endpoint. In many environments, that level of activity is sufficient to trigger rate limits.
In this case, only 1 out of the 5 scanned endpoints hit the limit. Together with the low effective coverage, this suggests that the scan never reached the level of depth required to properly test the application.
That sounds like good news. It isn’t. It reveals two problems at once:
- First, the scan barely tested those endpoints to begin with. It never generated enough valid traffic to exercise them in depth.
- Second, it signals that scan depth itself needs improvement. If the scan had been exercising endpoints more thoroughly, rate limits would likely have been triggered more consistently.
The rate limit wasn’t the ceiling. The scan never reached the ceiling.
Info
In a real testing environment, rate limits should be disabled during security testing. A test environment should be configured to allow complete and correct security testing. Other impediments that should be removed include WAF rules that block payloads with injection patterns. The testing environment should be sterile, isolated, and configured for testing. Production defenses belong in production, not in testing.
Why the difference?
This is where it gets interesting. The gap between crAPI and EnterpriseAPI comes down to two factors. Understanding them explains most dynamic security testing failures in production.
1. Test data quality
crAPI’s OpenAPI file came pre-configured with example test data values for every parameter. When the scanner builds requests, it uses those examples to create valid payloads. The requests work, the endpoints respond, and the scan can do its job. The same principle applies to a manual pentest: a tester who has valid test accounts and example payloads will reach more application logic than one working blind.
EnterpriseAPI’s OpenAPI file had no examples. Pydantic’s strict validation rejected almost everything before it even reached the application logic. The 5 endpoints that got scanned? Those are the ones with no parameters at all.
2. The good security paradox
This is the insight that gets missed most often.
EnterpriseAPI has strict input validation. It enforces Pydantic schemas. It rejects malformed requests. It has complex interdependencies where some endpoints require data from previous calls, certain fields need specific formats, and object relationships must be valid. That’s good engineering. That’s exactly how a robust API should be built.
But here’s the paradox: the same validation that protects the application in production is what blocks the scanner from testing it.
The scanner sends malformed payloads. Pydantic rejects them at the boundary. The scanner never reaches the business logic. So the IDOR vulnerabilities, the broken object-level authorization issues, the business logic flaws hiding beneath the surface - none of them get tested. Not because they don’t exist, but because the scanner couldn’t get past the front door.
This isn’t a flaw in the API’s design. It’s a gap in how security testing is configured. The API is doing exactly what it should. The testing setup isn’t equipped to meet it where it is.
The result is a false sense of security that’s actually worse than no test at all: you have a report, you have findings, you have a green checkbox. But the parts of the application most likely to contain business logic vulnerabilities were never touched.
What this baseline teaches us
These metrics reveal something uncomfortable: a completed scan with a vulnerability report tells you almost nothing about scan quality.
This problem isn’t specific to a particular tool or approach. Any dynamic testing workflow - whether automated, manual, or AI-assisted - can produce a report while leaving large parts of the attack surface untested. The blind spots are the same, and they remain invisible unless you measure what actually happened during the test.
This is what the data actually shows:
Coverage isn’t binary. In EnterpriseAPI, 84% of endpoints failed on every request. That’s not a scan result - it’s a configuration problem that would affect any testing approach relying on the same broken test data.
Failing endpoints are invisible risks. If you’re only looking at the final report, you’d never know that 27 endpoints in EnterpriseAPI weren’t tested at all. Those 27 endpoints could contain critical vulnerabilities that will never appear in any report.
Correct test data is non-negotiable. Input validation, strict schemas, complex business logic: for testing to work, whatever performs the test needs to send data that passes those validations. Without proper test data, no scanner, AI agent, or human tester can reach the application logic to test it.
Rate limits don’t appear in reports. A scanner that backed off due to a 429 response won’t tell you that it gave up. You have to look for it yourself.
Self-audit: are your scans lying to you?
These are three checks you can run against your own scan logs.
1. Check your 200 vs 400 ratio
Pull the HTTP response codes from your last scan. If more than 30-40% of responses are 4XX errors, most requests never reached application logic. You were testing the validation layer, not the application.
2. Look for 429 responses
Search your traffic logs for HTTP 429 responses. If they exist, the scanner hit a rate limit and backed off. The question isn’t whether it triggered once - it’s how many endpoints it abandoned afterward. If you find none, ask whether the scan generated enough traffic to trigger them at all.
3. Find the endpoints that never worked
Group responses by endpoint. Look for endpoints where every single request returned a 4XX or 5XX. If there are no 2XX responses for an endpoint, the scanner sent traffic but never executed any application logic. Those endpoints were technically “in scope” but never actually tested - any vulnerability inside them is invisible to your report.
If any of those checks surface a problem, you have data - not a hunch - that your scan results can’t be trusted at face value.
The uncomfortable question
This baseline shows where the starting point is: two APIs, one with decent coverage and one that’s barely tested at all. Both scans completed successfully. Both generated reports. But the data tells a completely different story.
Which one is your production API more like?
In the next post in this series, the focus shifts to the most impactful change in automated scanning: improving how valid requests are built.